Cross Sectional Extreme Value Analysis #
Juan-Juan and I are tracking the development of the novel coronavirus in the Netherlands. On this page we provide regular updates of the cross-sectional analysis of the infection rates over Dutch municipalities. Read the description of our current and historical data sets here.
Our Method #
RIVM currently publishes update weekly. For daily statistics before June 15, please visit here.
Following RIVM, we use the cross-sectional data of the new patients in the last two weeks over 355 Dutch municipalities.
We select a set of the most infected municipalities and compare:
- the moment estimates of extreme values index and high quantiles; and
- the maximum likelihood estimates by fitting a generalized Pareto distribution.
We report the current and historical statistics:
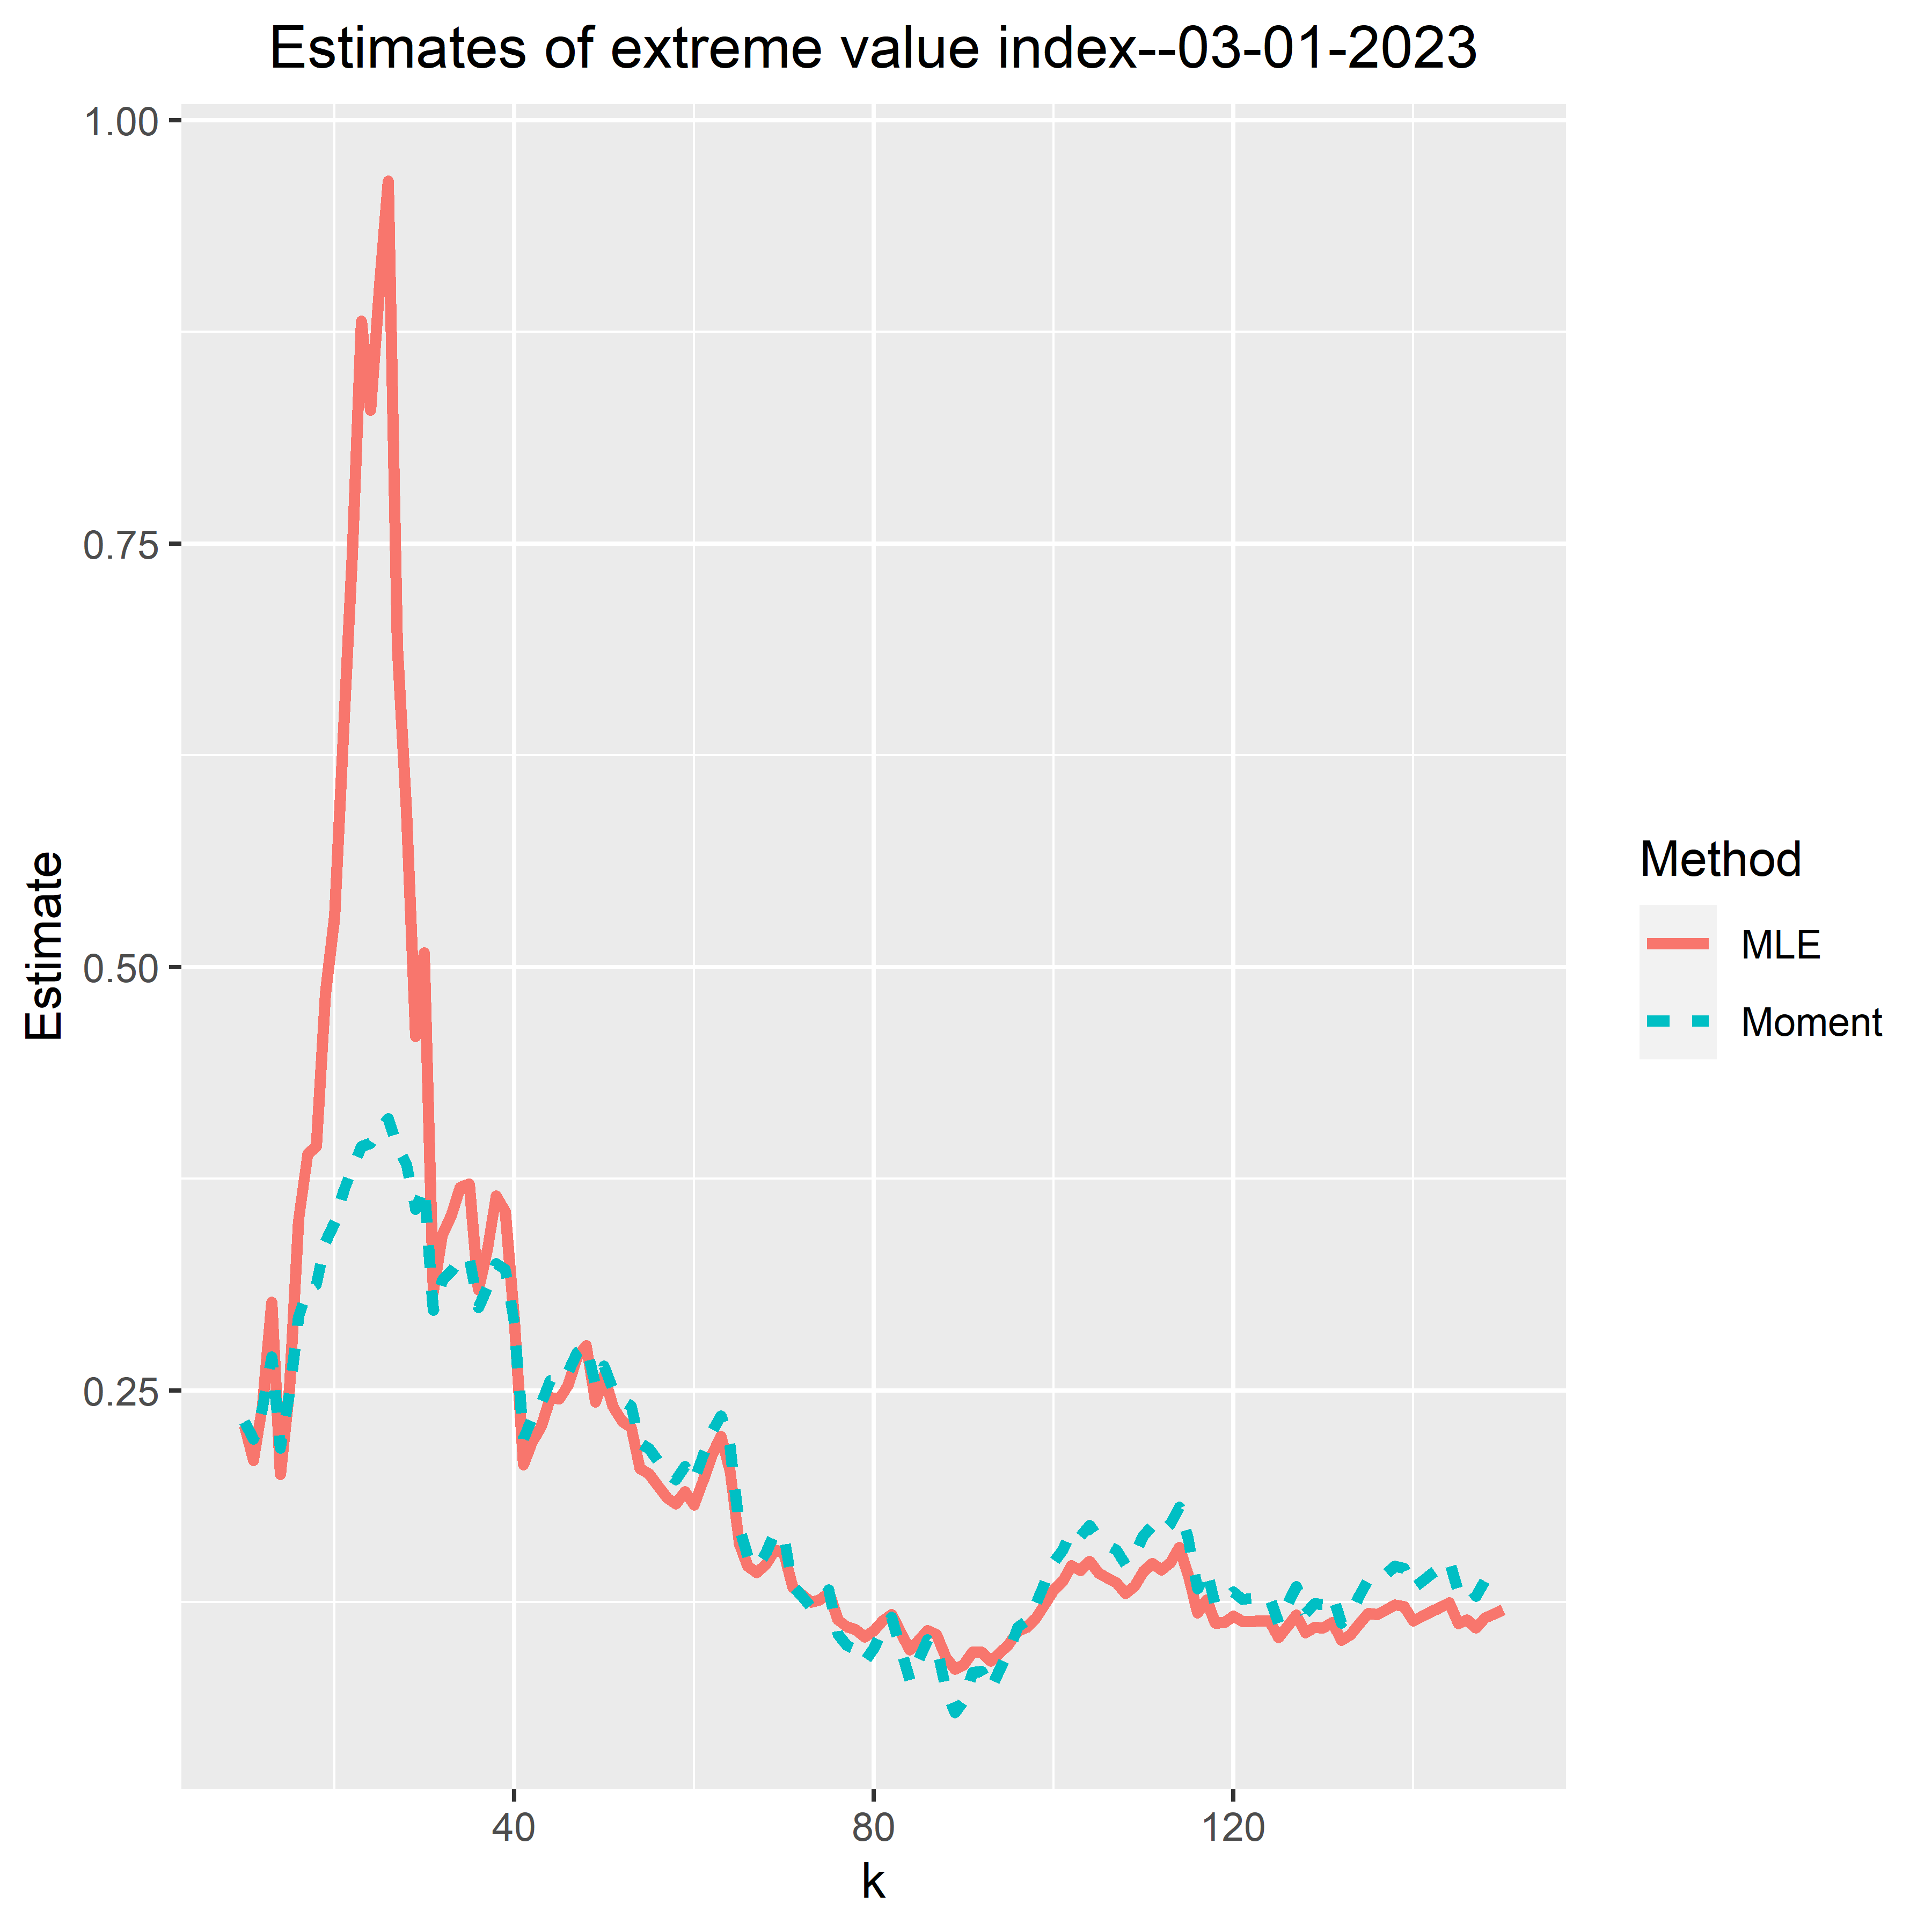
- Extreme Value Index. The higher index is, the larger heterogeneity among the most infected cities.
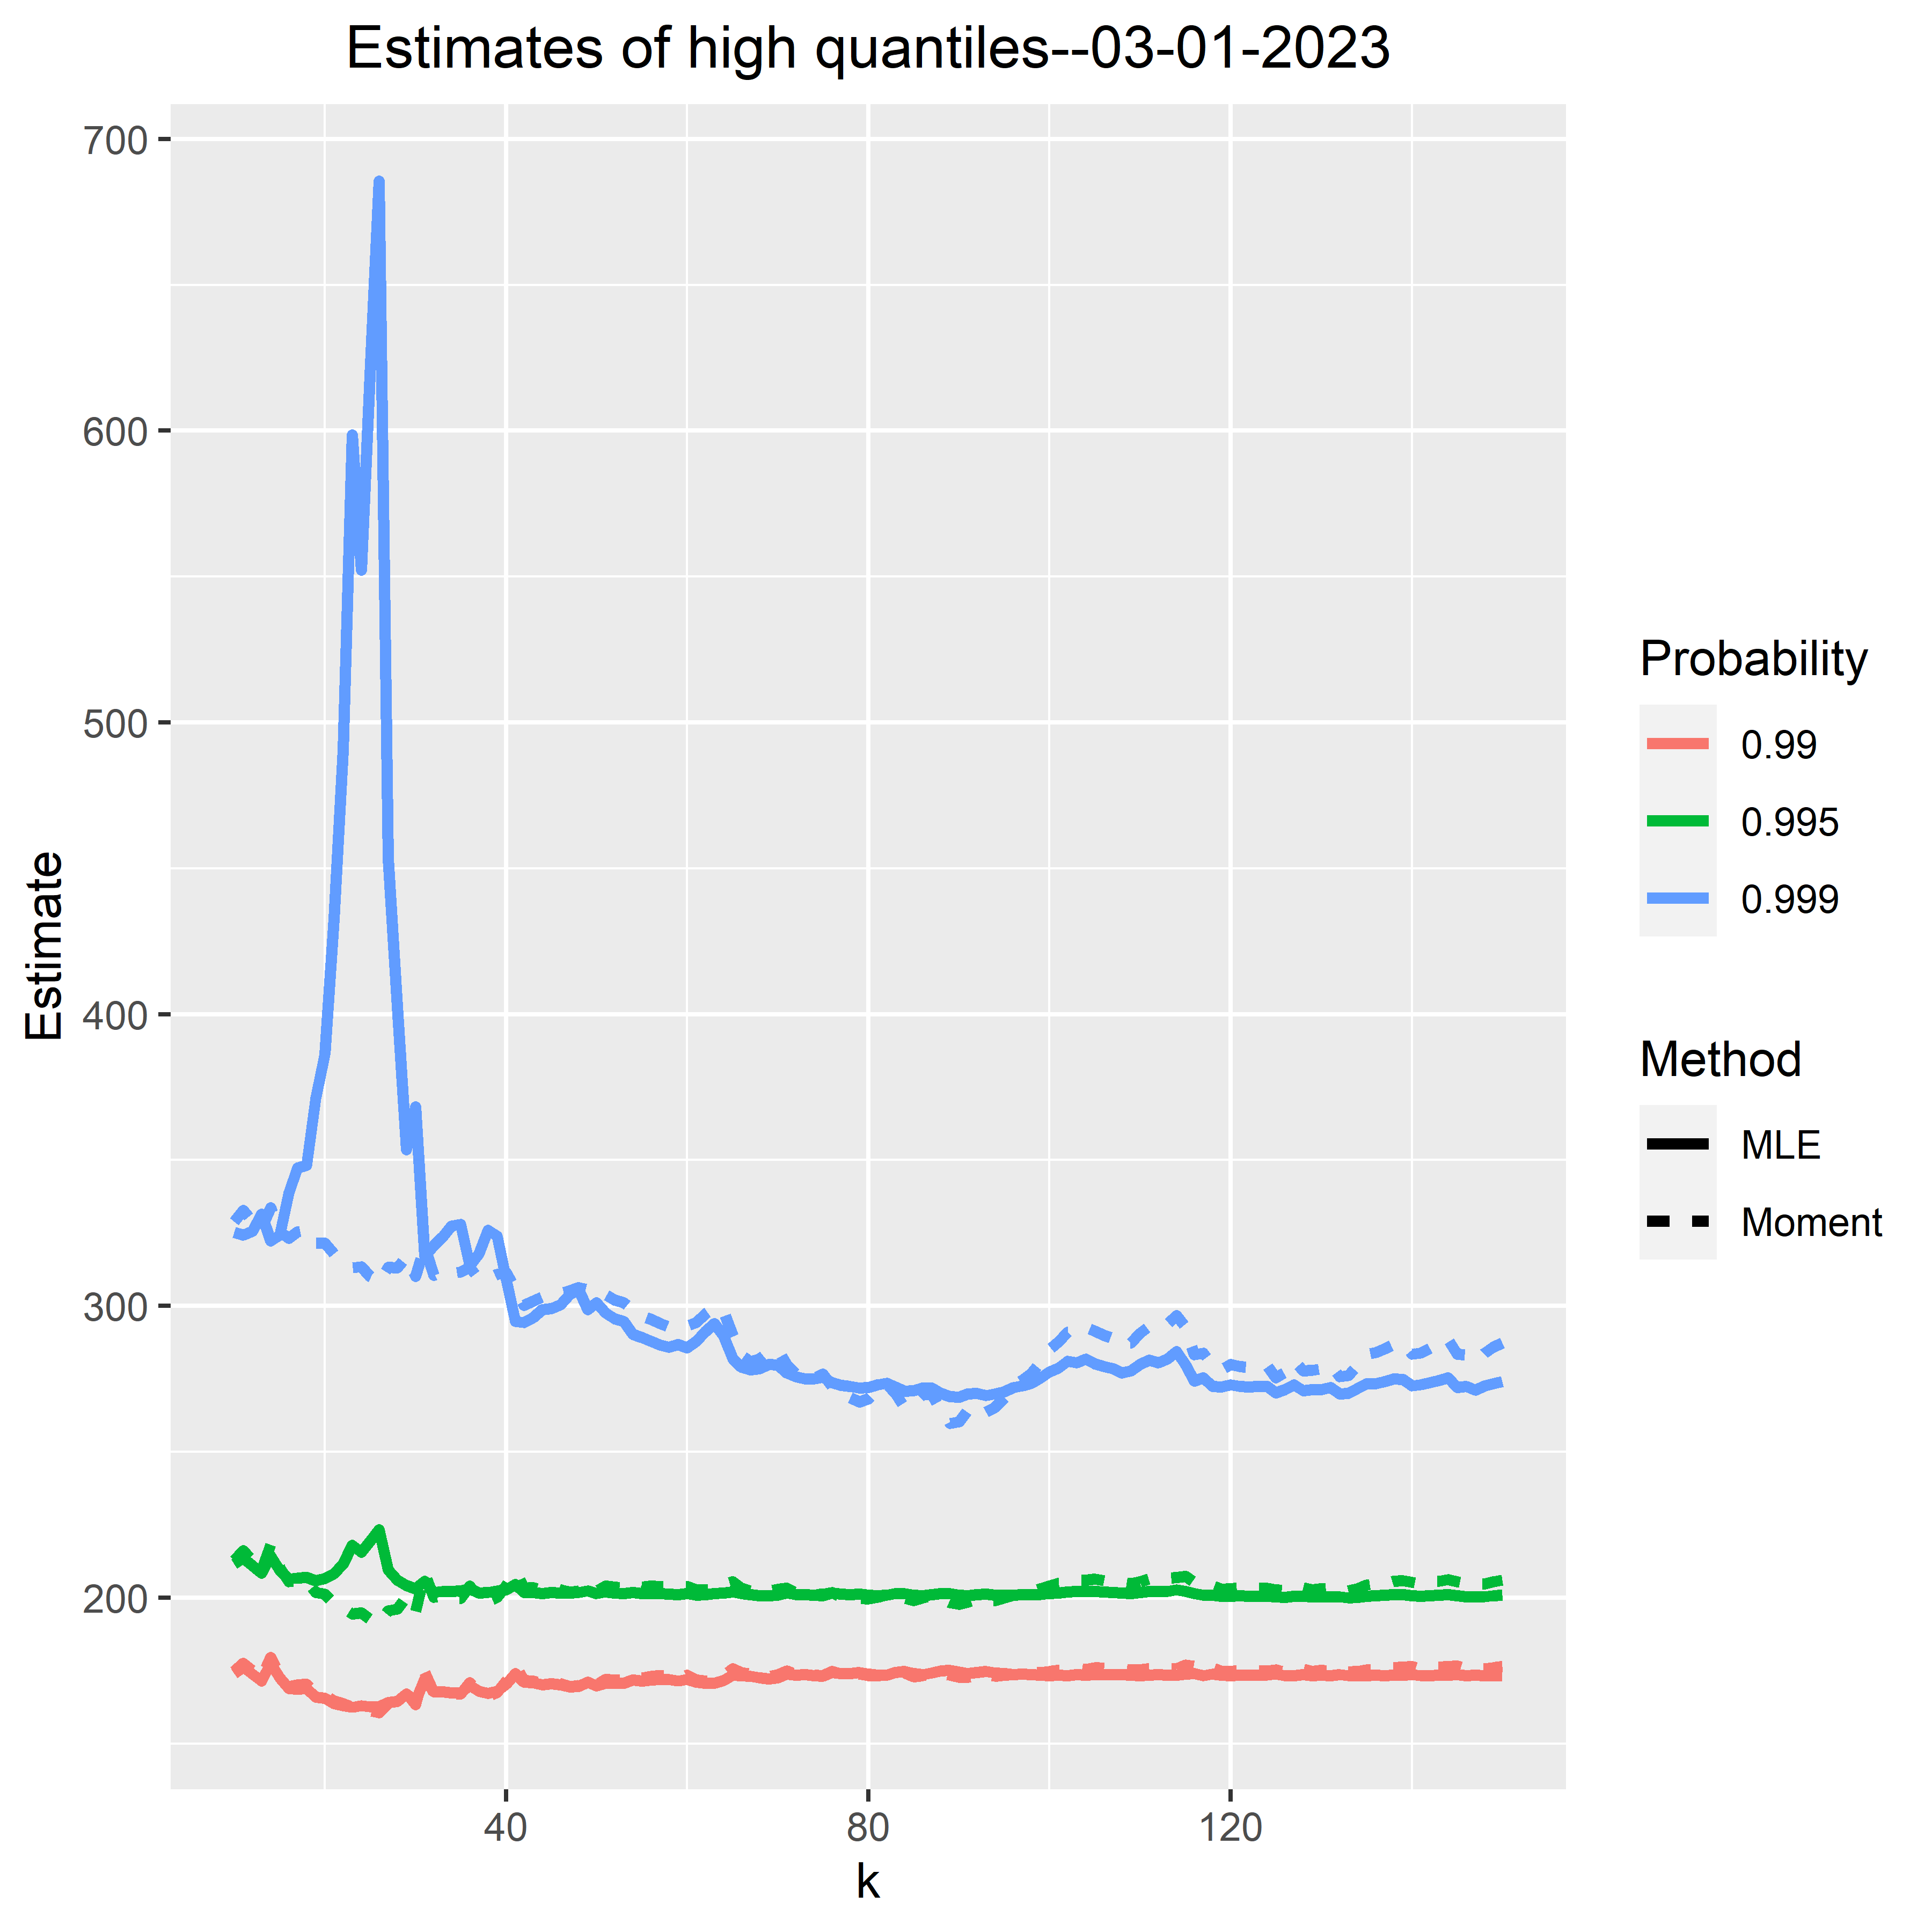
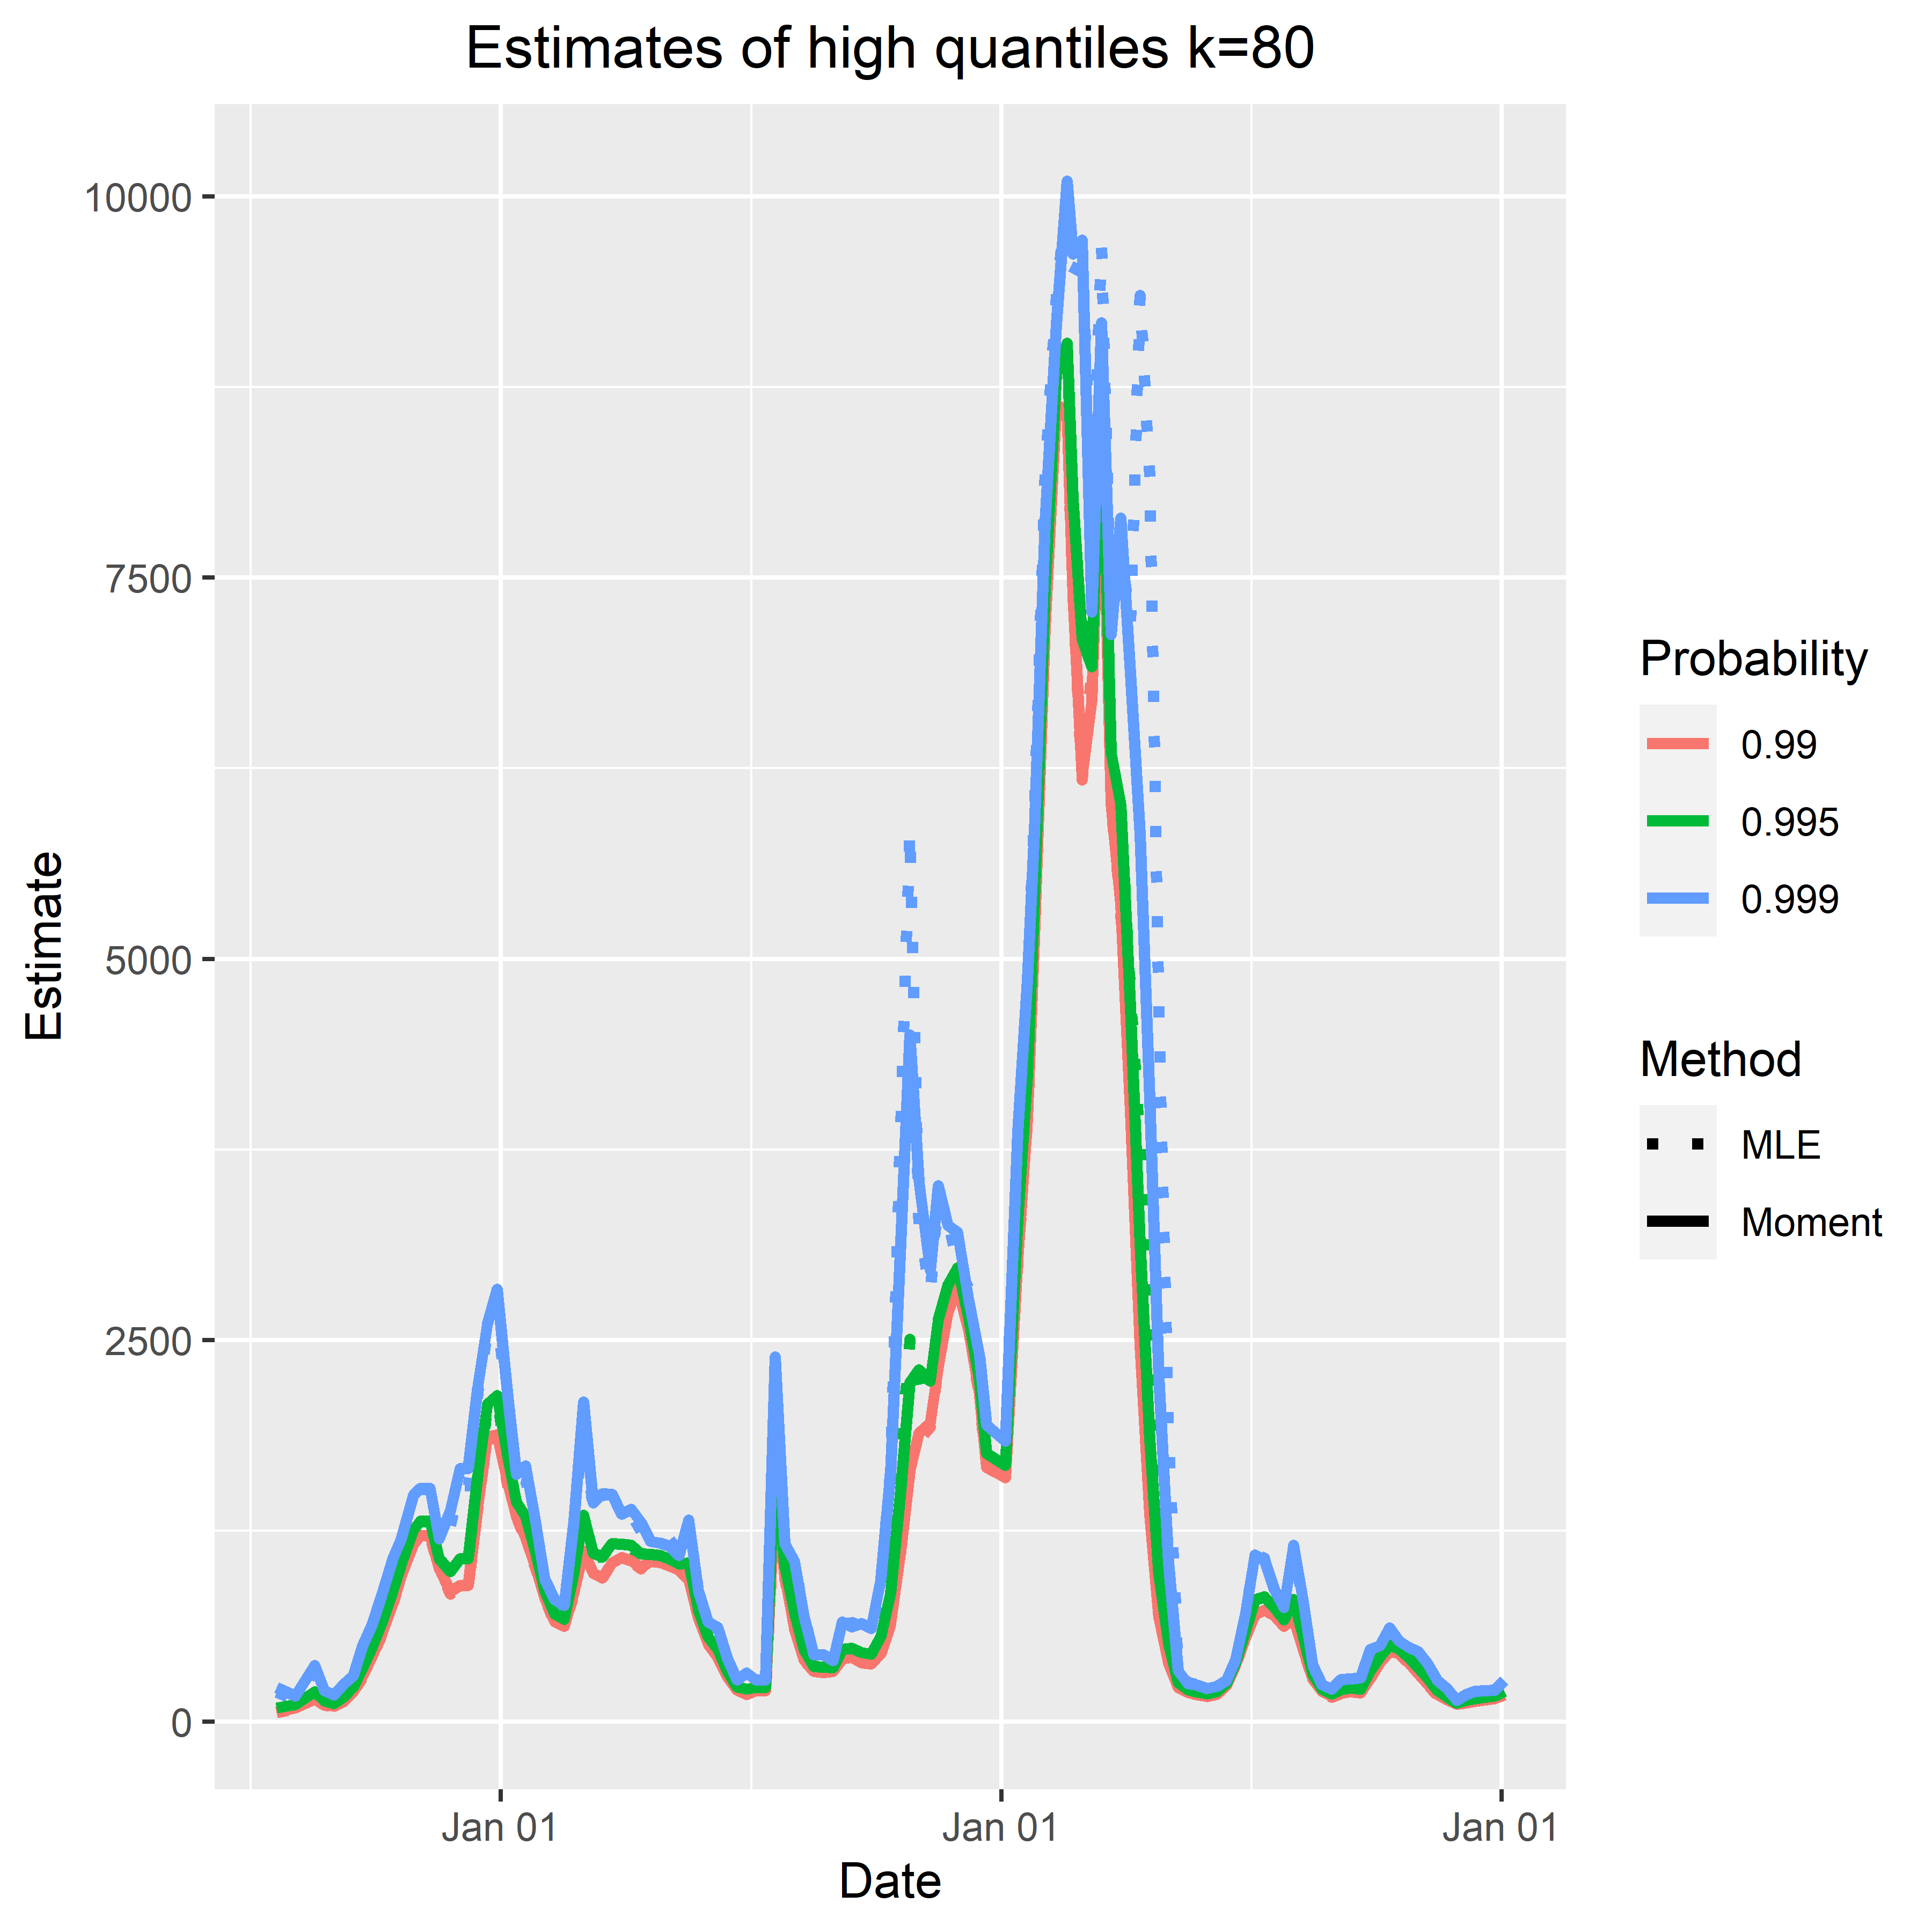
- High quantiles at level 99.9%, 99.5% and 99%.
- Fitted probability density function for the exceedances, for an expert/automatic choice of number of the most infected municipalities used in tail estimation.
Weekly Statistics (update on Tuesdays) #
The number k = number of the most infected municipalities used in tail estimation
infection rates = the number of positive tested persons per 100,000 residents
Extreme value index today:
High quantiles today:
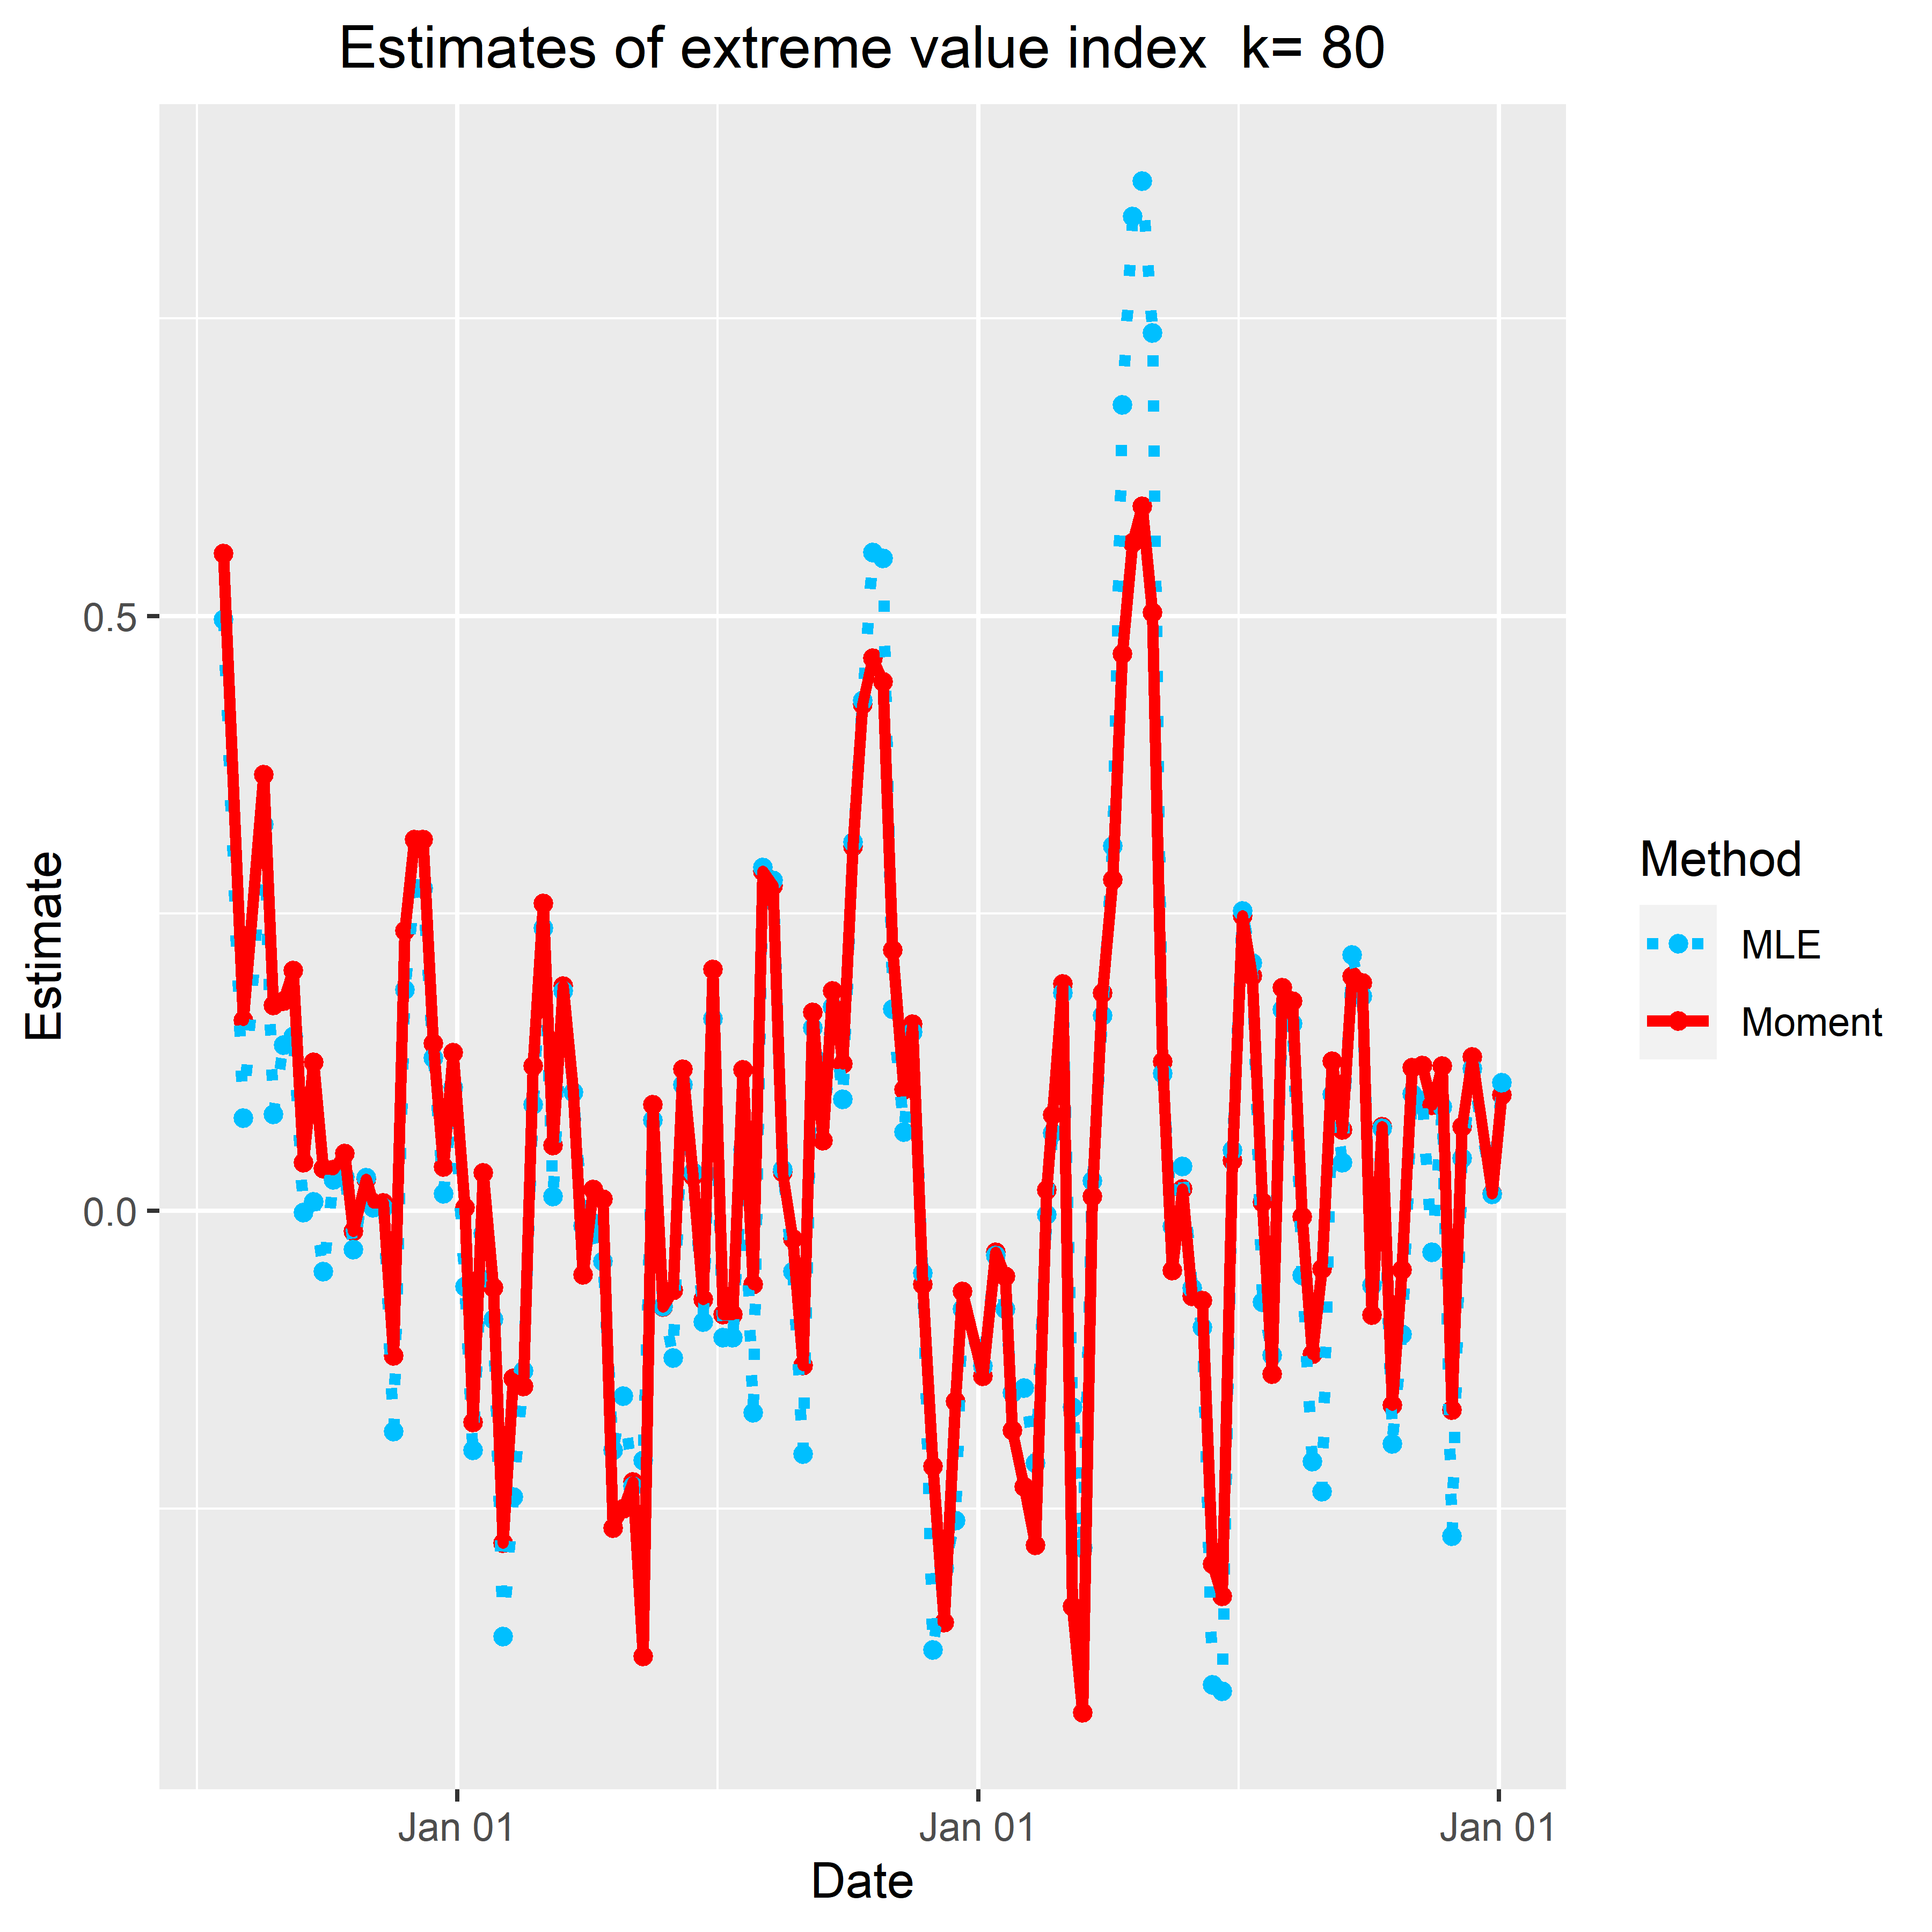
Historical Statistics (as of 21 July) #
Extreme value indexes: more results here
High quantiles: more results here
Fitted probability density functions: more results here
Update history #
- August 18: We start reporting weekly statistics based on the data from July 21. The older statistics are archived here.
- April 10: We have resumed the analysis for infection rates, as the data are available again.
- March 31: We have adapted our analysis to the hospitalization rates, as RIVM’s website.
- March 23: We have fixed a bug in the code, and made slight corrections to our statistics. There was one city missing in the tail estimation. We have added it back.
- March 23: we are adding the moment estimates of high quantiles to our daily and historical statistics. The moment estimates tend to be more stable over the choice of k during the recent period.